Statement of Revenue, Expenses and Changes in Fund Balances ($ Thousands)
Notes
1
Direct fundraising
expenses represent
costs for logistics,
marketing and other
expenses directly
related to fundraising
activities including
those for our major
events such as the
Enbridge Ride to
Conquer Cancer
,
Shoppers Drug Mart
Weekend to End
Women’s Cancers
and our Direct
Marketing programs.
2
General fundraising
and administrative
expenses are the
overhead costs
associated with
running the
Foundation
operations.
Year ended March 31
2010 2011 2012 2013 2014
Gross fundraising revenue
70,530
75,368
80,146
85,911
94,917
Direct fundraising expenses
1
(12,308)
(13,274) (14,853) (16,799) (14,092)
Net fundraising revenue
58,222
62,094
65,293
69,112 80,825
Direct fundraising expenses/Gross fundraising revenue 17.5% 17.6% 18.5% 19.6% 14.9%
Gross lottery revenue
50,206
52,210
56,778
58,193
63,022
Direct lottery expenses
(38,457)
(37,060) (39,549) (38,823) (41,940)
Net lottery revenue
11,749
15,150
17,229
19,370
21,082
Direct lottery expenses/Gross lottery revenue
76.6% 71.0% 69.7% 66.7% 66.5%
Net fundraising and lottery revenue
69,971
77,244
82,522
88,482 101,907
Investment income (loss)
43,658
22,790
13,940
33,010
33,153
Net revenue, including investment income
113,629
100,034
96,462
121,492 135,060
General fundraising and administrative expenses
2
6,744
7,670
8,233
9,167
9,804
General fundraising and administrative expenses /
9.6% 9.9% 10.0% 10.4% 9.6%
Net fundraising and lottery revenue
(excluding investment income (loss))
Excess of revenue over expenses before grants
106,885
92,364
88,229
112,325 125,256
Grants to Ontario Cancer Institute/
Princess Margaret Cancer Centre
Building
1,514
2,830
7,030
4,913
7,208
Research, education and patient care
47,463
49,002
51,832
57,866
52,191
Equipment
4,841
2,490
4,622
2,000
3,002
53,818
54,322
63,484
64,779
62,401
Excess of revenue over expenses and grants
53,067
38,042
24,745
47,546
62,855
Fund Balances
Endowments
108,652
117,701
111,414
121,487 142,347
Restricted
165,769
194,788
226,974
264,128 306,199
Unrestricted
10,161
10,135
10,032
10,351
10,275
284,582
322,624
348,420
395,966 458,821
Held by University of Toronto
10,330
11,085
10,983
11,716
13,148
Total Capital
294,912
333,709
359,403
407,682 471,969
Each year,The Princess Margaret Cancer Foundation reports on the funds it raises and stewards in two ways:
via Audited Financial Statements (AFS) included in this report or online at
, and via the
standard CRA T3010 form required of all not-for-profit organizations and found on the CRA website at
. While both formats utilize the same financial information, the Foundation’s AFS provides
a more detailed look to better assess and control our financial performance.
5-Year Financial Summary
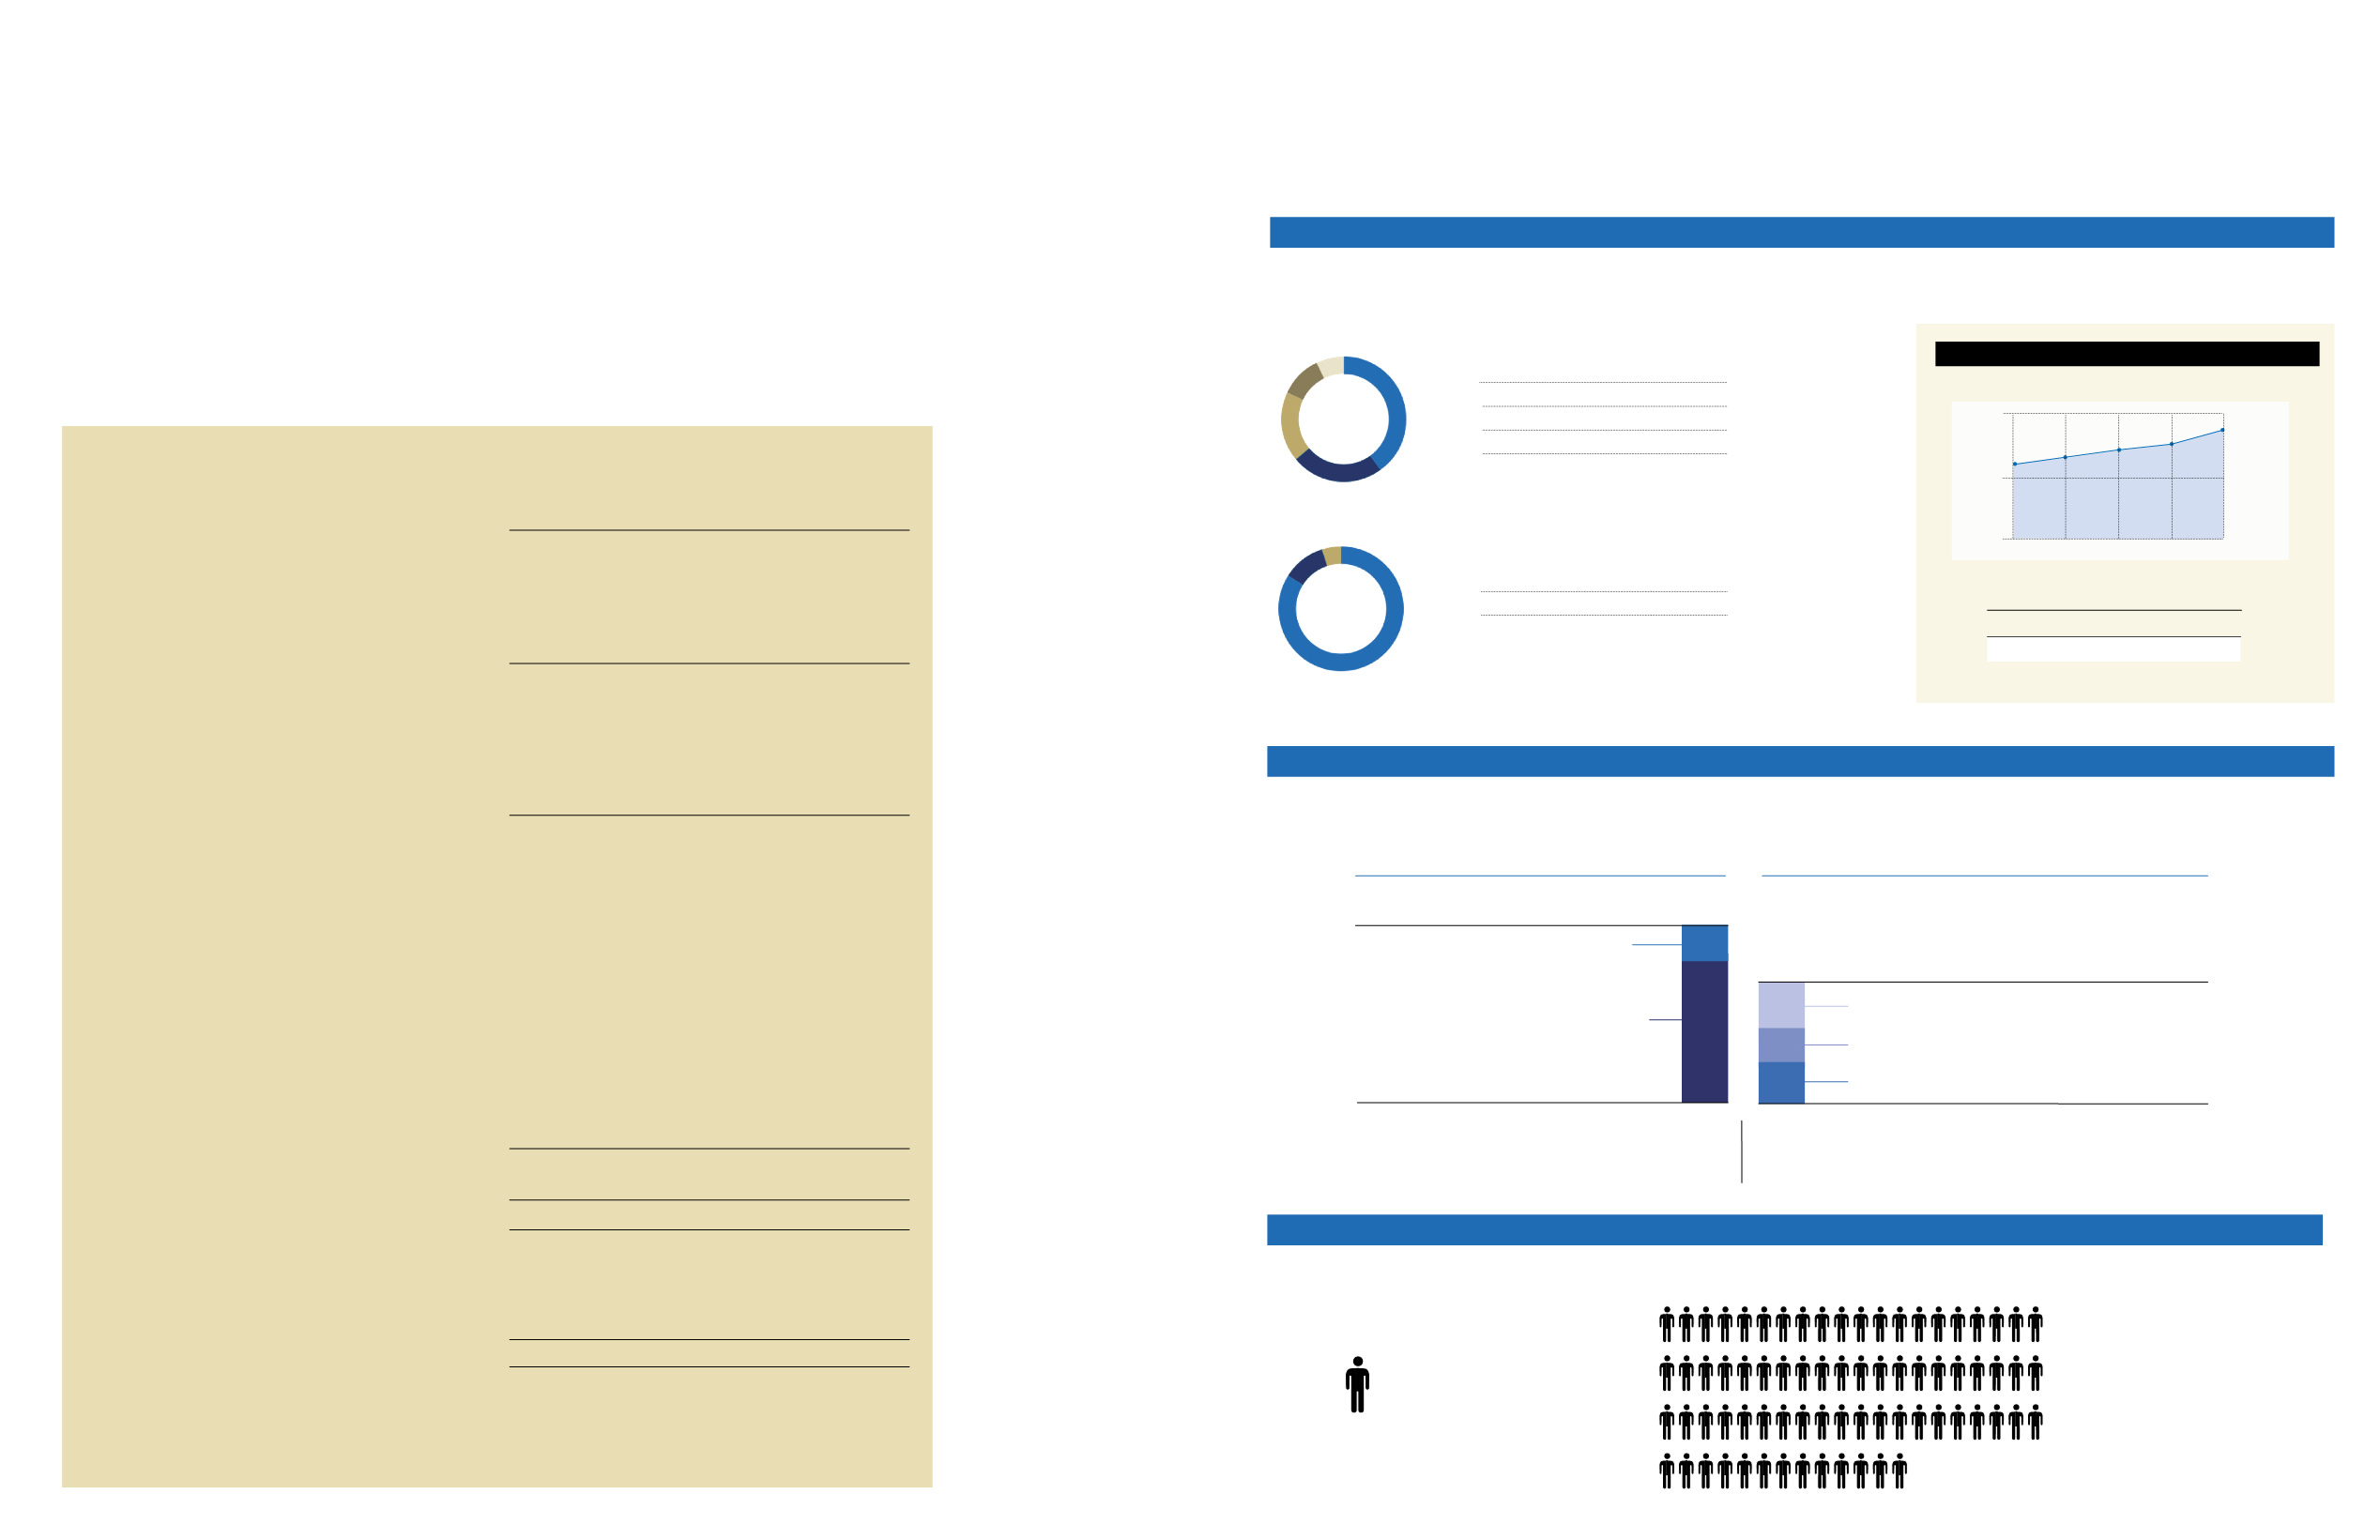
Based on reported gross fundraising revenue and lottery revenue ($158 million)
Grants spent this year by Princess Margaret Cancer Centre ($62.4 million)
Financial Summary – Fiscal 2014
The Princess Margaret Cancer Foundation is passion te about impact, efficient fundraising and effective
stewardship, so that our collective vision to Conquer Cancer in Our Lifetime can be achieved.
The PMCF is best-in-class relative to our peers across the country.
2010 2011 2012 2013 2014
9.6% 9.9% 10.0% 10.4%
9.6%
Year-over-year highlights
Net fundraising and lottery revenue ($ thousands)
General fundraising and administrative expenses
Fulfilling our mission
Our mission is to raise and steward funds to deliver breakthrough research, exemplary teaching, and compassionate care at the
Princess Margaret Cancer Centre, one of the top 5 cancer research centres in the world.
Distinct revenue streams
Gross revenue (excluding investment income) of $158 million disclosed in the CRA T3010 form is composed of two distinct revenue
streams: fundraising revenue and lottery revenue. Cost ratios associated with these streams are treated differently by the CRA.
Fundraising efficiency measure
The PMCF raised $1.4 million per full-time employee, making it one of the most efficient and effective charities in Canada.
■
Research, Education,
84%
Patient Care
■
Building
11%
■
Equipment
5%
■
Lotteries
40%
■
Major Gifts and Bequests 24%
■
Strategic Events
18%
■
Annual Programs
11%
■
Other
7%
120,000
60,000
0
2010
2011
2012
2013
2014
$101.9
million
= $1.4 million
net revenue
= $101.9 million
net revenue
SOURCES
OF
REVENUE
HOW
GRANTS
ARE USED
gross fundraising revenue
$63.0 million
lottery prizes
$23.1 million
marketing and other expenses
$18.8 million
net lottery revenue
$21.1 million
$94.9 million
gross fundraising revenue
$14.1 million
fundraising expenses
$80.8 million
net fundraising revenue
Direct fundraising expenses include costs for logistics,
marketing, and other costs directly related to strategic events
and annual programs.
The PMCF lottery net revenue return of 33.5% compares favourably
to the industry average return of 29.0% based on the three largest
charitable lotteries in Canada. The PMCF lottery cost ratio of 66.5%
is substantially lower than CRA acceptable guidelines (70%+).
Fundraising revenue
Lottery revenue
Beyond funds granted this year ($62.4 million), the Foundation has multi-year
research and clinical commitments in progress at Princess Margaret Cancer Centre.
14.9
%
36.7
%
29.8
%
33.5
%
85.1
%


