


 44 / 50

Financial Summary – Fiscal 2015
The Princess Margaret Cancer Foundation is passionate about impact, efficient fundraising, and
effective stewardship, so that our collective vision to Conquer Cancer In Our Lifetime can be achieved.
Fulfilling our Mission
Our mission is to raise and steward funds to deliver
breakthrough research, exemplary teaching, and
compassionate care at the Princess Margaret Cancer Centre,
one of the top 5 cancer research centres in the world.
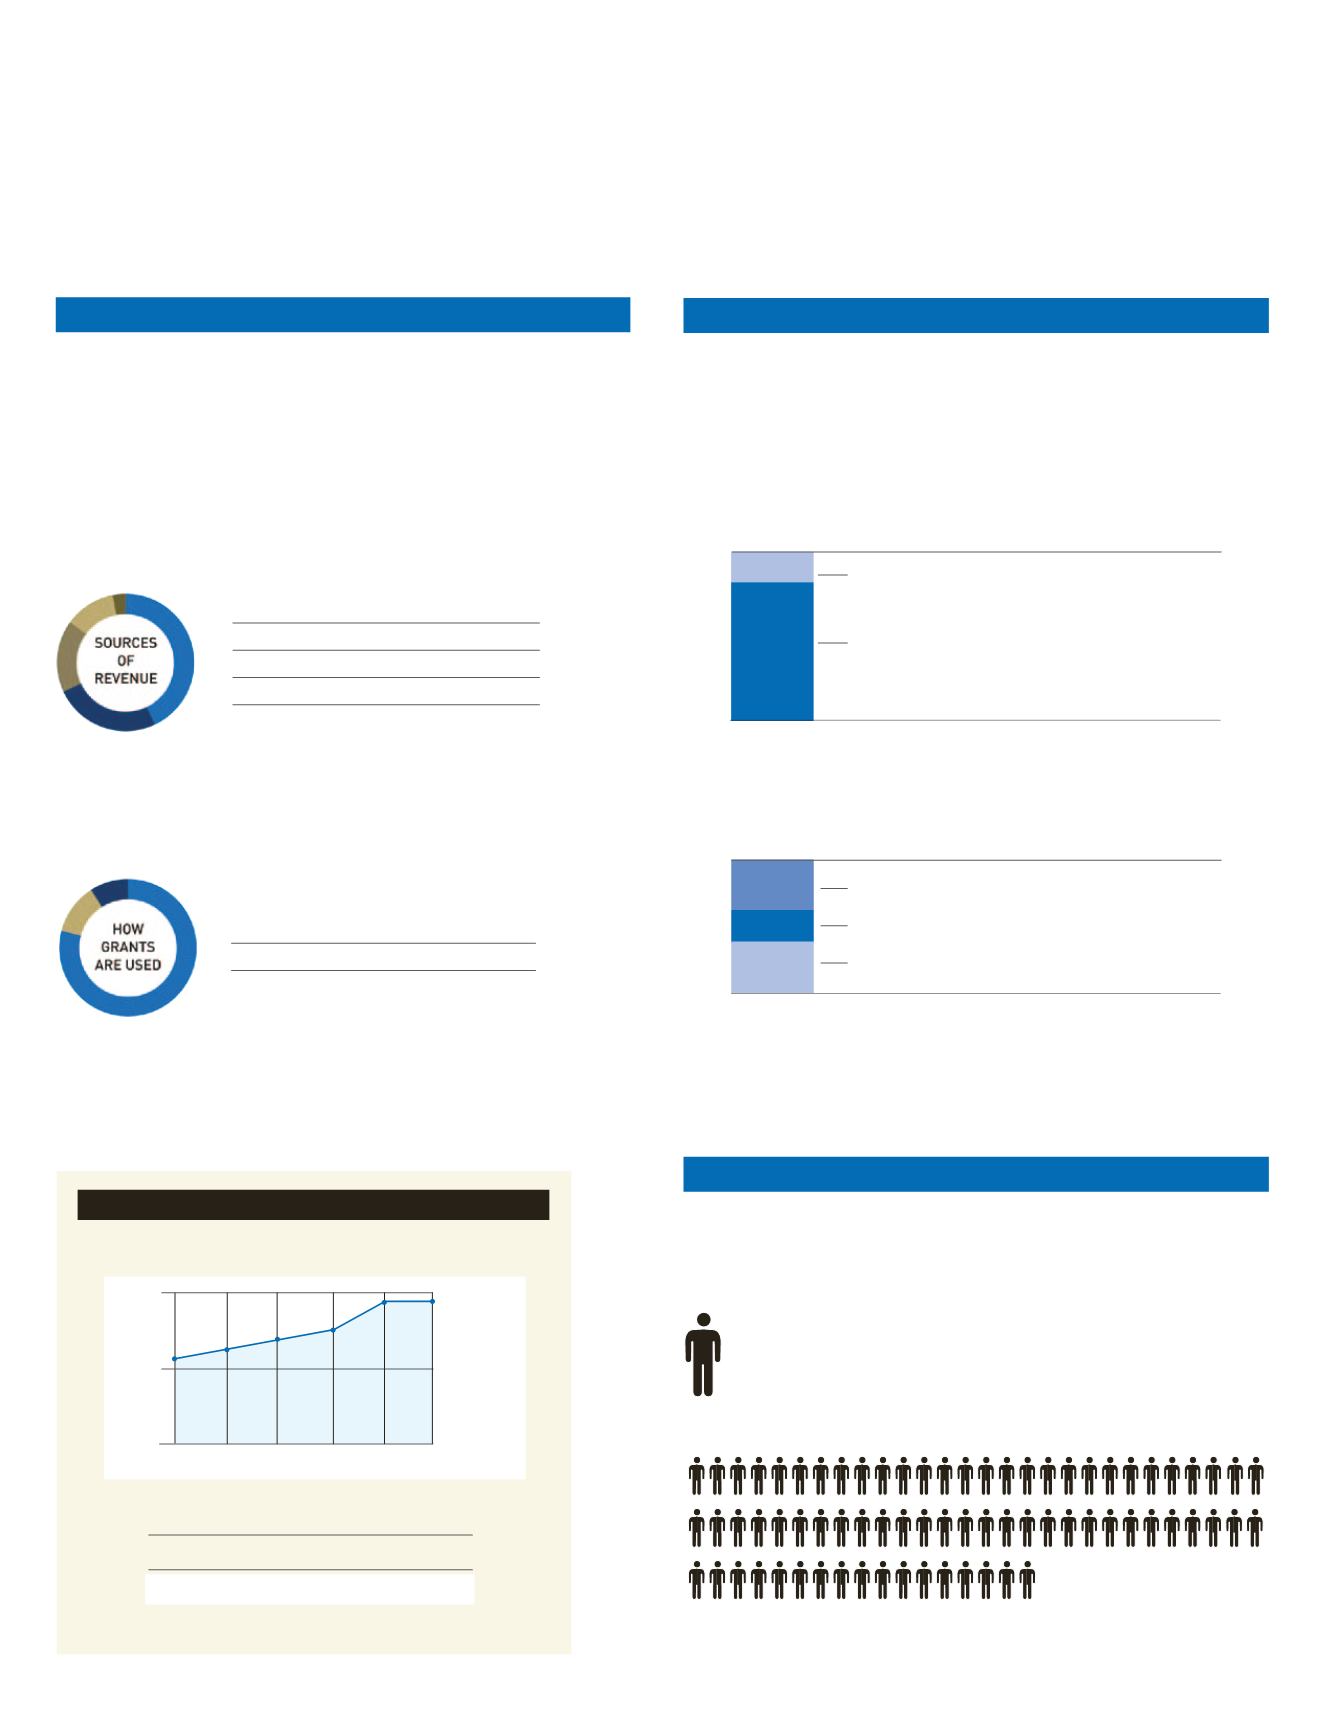
Distinct revenue streams
Gross revenue (excluding investment income) of $165 million
disclosed in the CRA T3010 form is composed of two distinct
revenue streams: fundraising revenue and lottery revenue.
Cost ratios associated with these streams are treated
differently by the CRA.
Fundraising efficiency measure
The PMCF raised $1.4 million per full-time employee, making
it one of the most efficient and effective charities in Canada.
Based on reported gross fundraising revenue and lottery
revenue ($165 million):
■
Lotteries
43%
■
Major Gifts and Bequests 25%
■
Strategic Events
17%
■
Annual Programs
12%
■
Other
3%
Grants spent this year by Princess Margaret Cancer Centre
($95.5 million):
Beyond funds granted this year ($95.5 million), the Foundation has
multi-year research and clinical commitments in progress at Princess
Margaret Cancer Centre.
■
Research, Education,
79%
Patient Care
■
Building
12%
■
Equipment
9%
The PMCF is best-in-class relative to our peers across the country.
Year-over-year highlights
General fundraising and administrative expenses
2010 2011 2012 2013 2014 2015
9.6% 9.9% 10.0% 10.4% 9.6% 9.9%
2010 2011 2012 2013 2014 2015
$101. 9
million
Net fundraising and lottery revenue ($millions)
120
60
0
= $1.4 million net revenue
= $101.9 million net revenue
Direct fundraising expenses include costs for logistics, marketing, and other
costs directly related to strategic events and annual programs.
Fundraising revenue
fundraising expenses
$16.2 million
net fundraising revenue
$78.1 million
gross lottery revenue
$70.9 million
lottery prizes
$26.1 million
marketing and other expenses
$21.0 million
net lottery revenue
$23.8 million
Lottery revenue
The PMCF lottery net revenue return of 33.5% compares favourably to
the industry average return of 24.7% based on the three largest charitable
lotteries in Canada. The PMCF lottery cost ratio of 66.5% is substantially
lower than CRA acceptable guidelines (70%+).
36.9
%
29.6
%
33.5
%
gross fundraising revenue
$94.3 million
17.2
%
82.8
%